
Delivering energy
where it is needed.
Sails drive the ship. Turbines under the hull turn that motion into electricity. An onboard electrolyser banks it as green hydrogen — and the whole fleet is routed to wherever the wind is strongest.
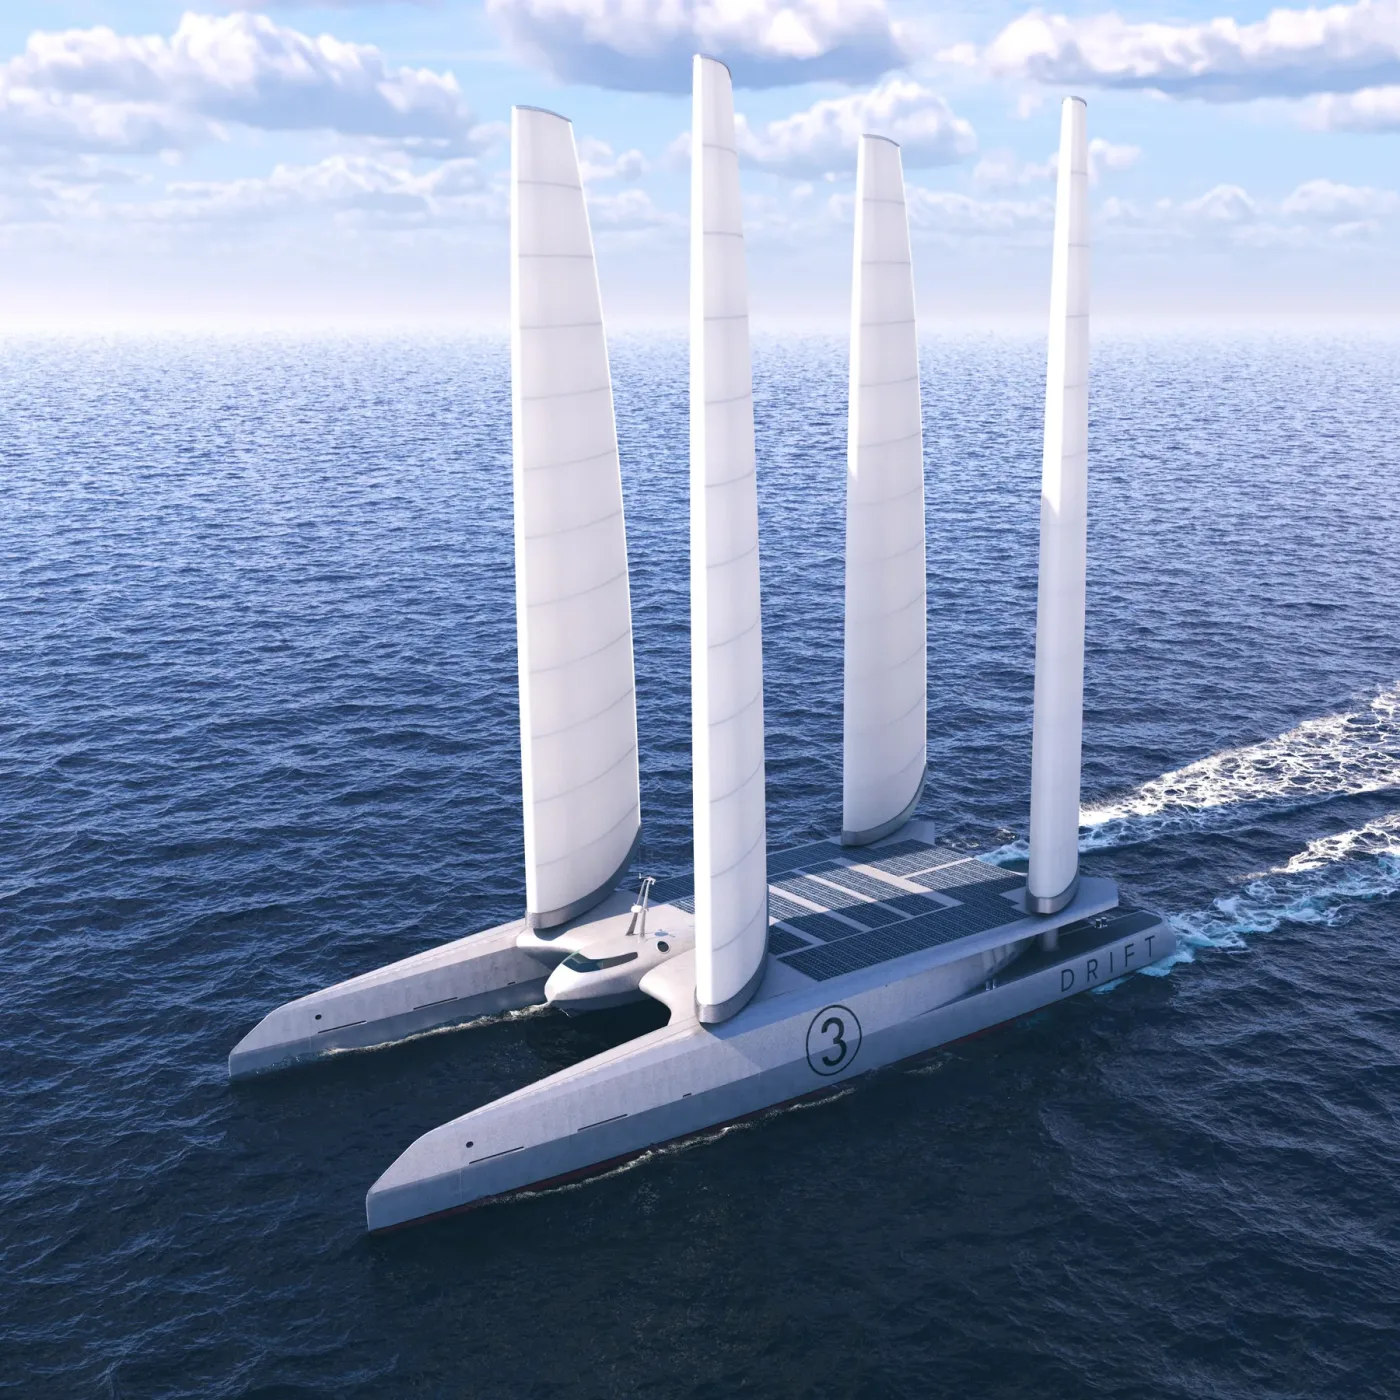
A wind farm waits for the wind. This ship goes and finds it.
Mobility is the advantage that unlocks Oceans of Energy. A fixed turbine takes whatever weather arrives; a DRIFT ship is routed into stronger wind, stays there, and brings the energy home as green hydrogen.
-
More power+2 kts
Routed into stronger wind and kept there: 16 knots on average across a year of voyages, against 14 at a North Sea wind farm site.
Modelled · 2021 -
More of the time>80%
Load factor, because the ship moves with the weather rather than waiting for it. Close to twice North Sea wind.
Modelled · 2021 -
In more places70%
Of the planet is ocean, and all of it is the field of play. From the Atlantic to the Pacific, the trade winds are the resource.
Fact -
More quickly10×
Faster to commission. No grid connection, no planning queue, no seabed works: build the ship and sail it.
Target
- Shipping operators Green hydrogen delivered to vessels in port or at sea, and passage through net zero waters.
- Heavy industry Flexible delivery at consistent prices and volumes, clear of gas and wholesale price swings.
- Island nations A non-invasive renewable suited to island geography, and a route from importing energy to exporting it.
Leave nothing behind but oxygen.
DRIFT goes where the action is.
The concept, the prototypes and the backing behind it.
Four pillars of DRIFT, and how we are validating them.
Each is an existing technology being pushed into new operating conditions and configurations, requiring modelling and validation.
Find the wind, capture it, turn it into energy. The same on every DRIFT ship.
-
 The route
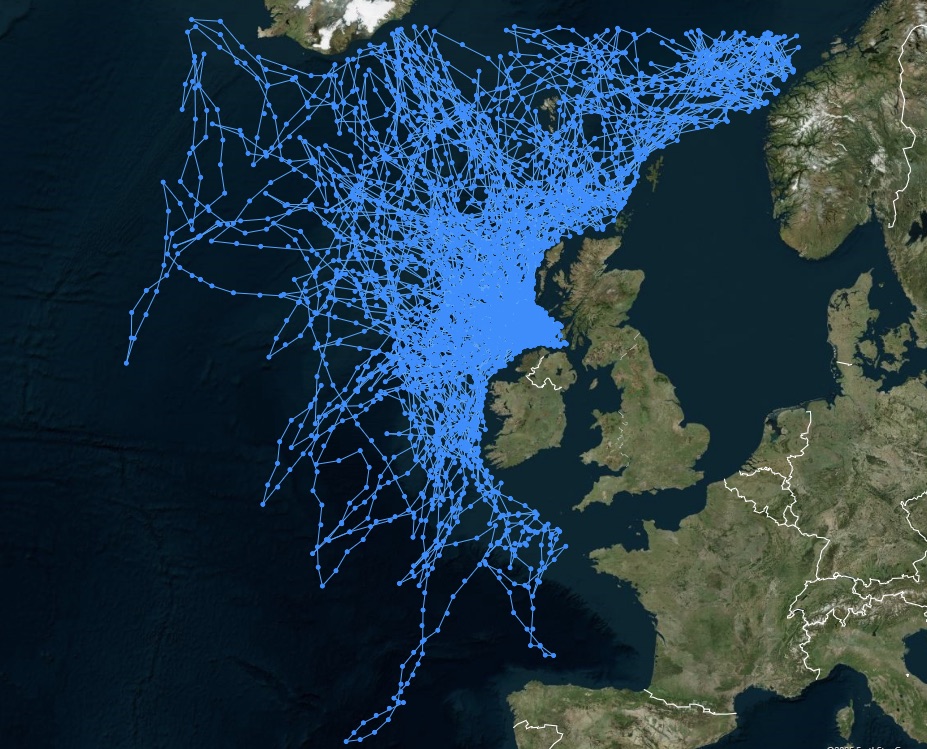
developed with FacultySeveral moves ahead, not one.
Faculty was asked for something narrower than a navigation aid: given a forecast, maximise the rate of energy generation over a fixed window. Their own description is a chess player reading a board — the strongest wind three days out is worth crossing weak wind to reach, and a greedy route arrives in the wrong ocean.
- Objective — energy harvested, not passage time or fuel burn
- Horizon — several time-steps ahead, not the next best move
- Constraint — the return leg, timed to the filling tank
-
 The rig
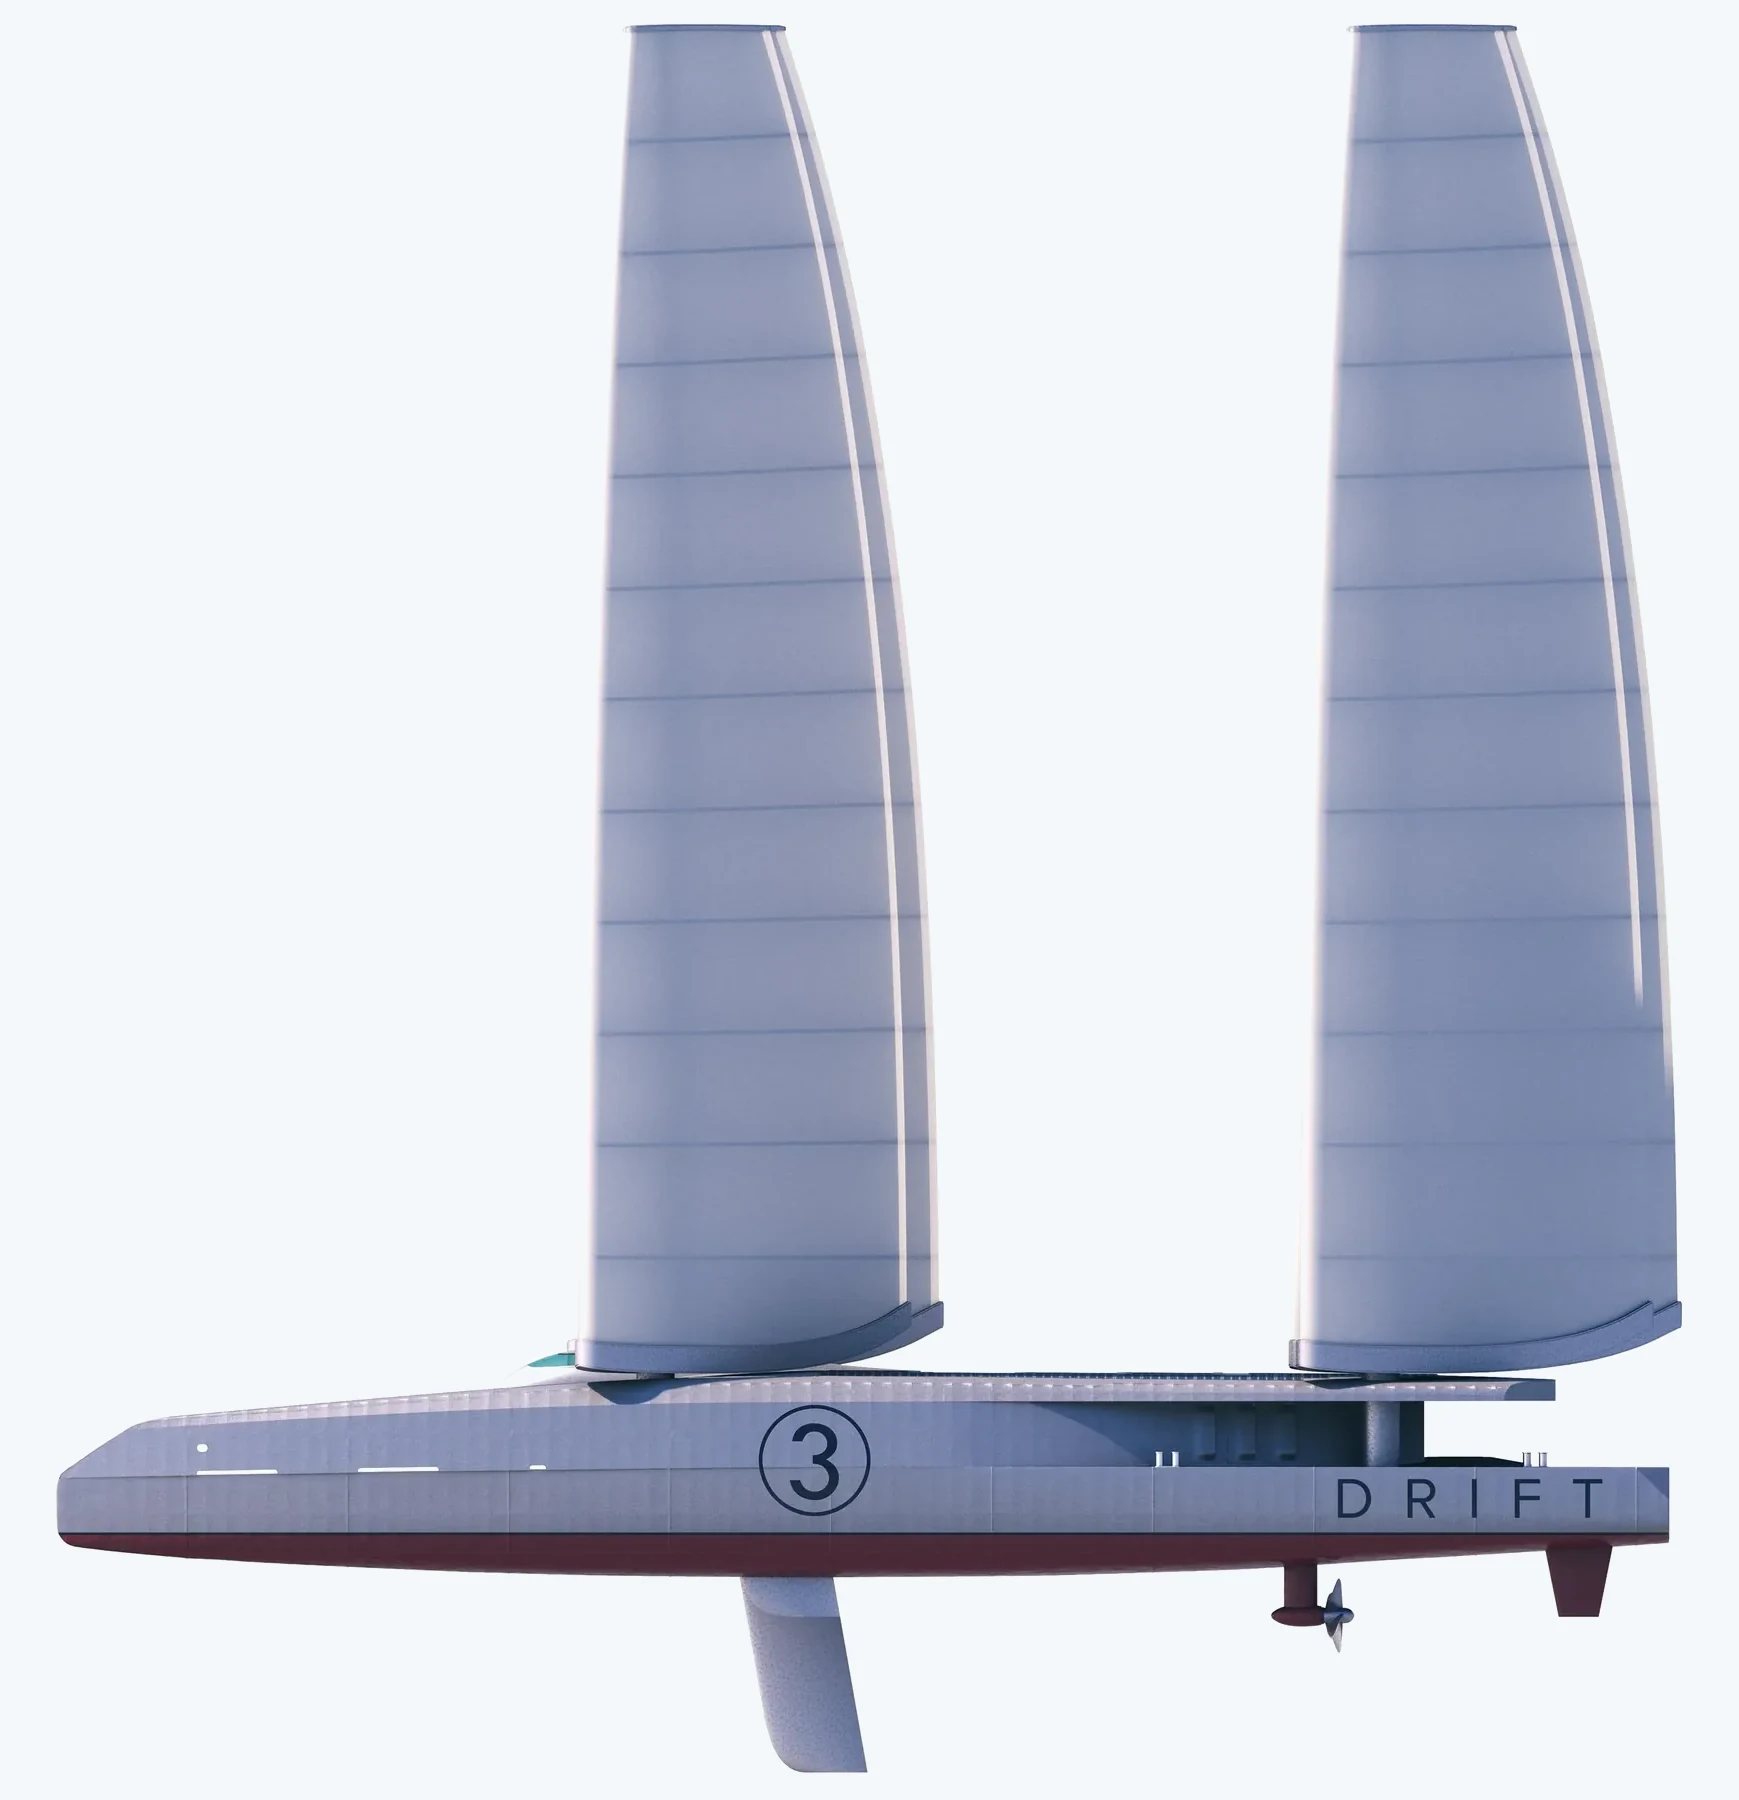
validated with Cape HornLarge sail area, small platform.
The generation target sets the sail area, not a passage speed — and that area has to stand on a relatively small platform. It is a configuration conventional sailing practice does not offer, so air flow is modelled to understand the interactions around the rigs.
- Sail area — sized for the power the turbines have to make
- Platform — a slender hull carrying an area drawn for generation
- Configuration — no existing practice has a precedent for it
-
 The turbine
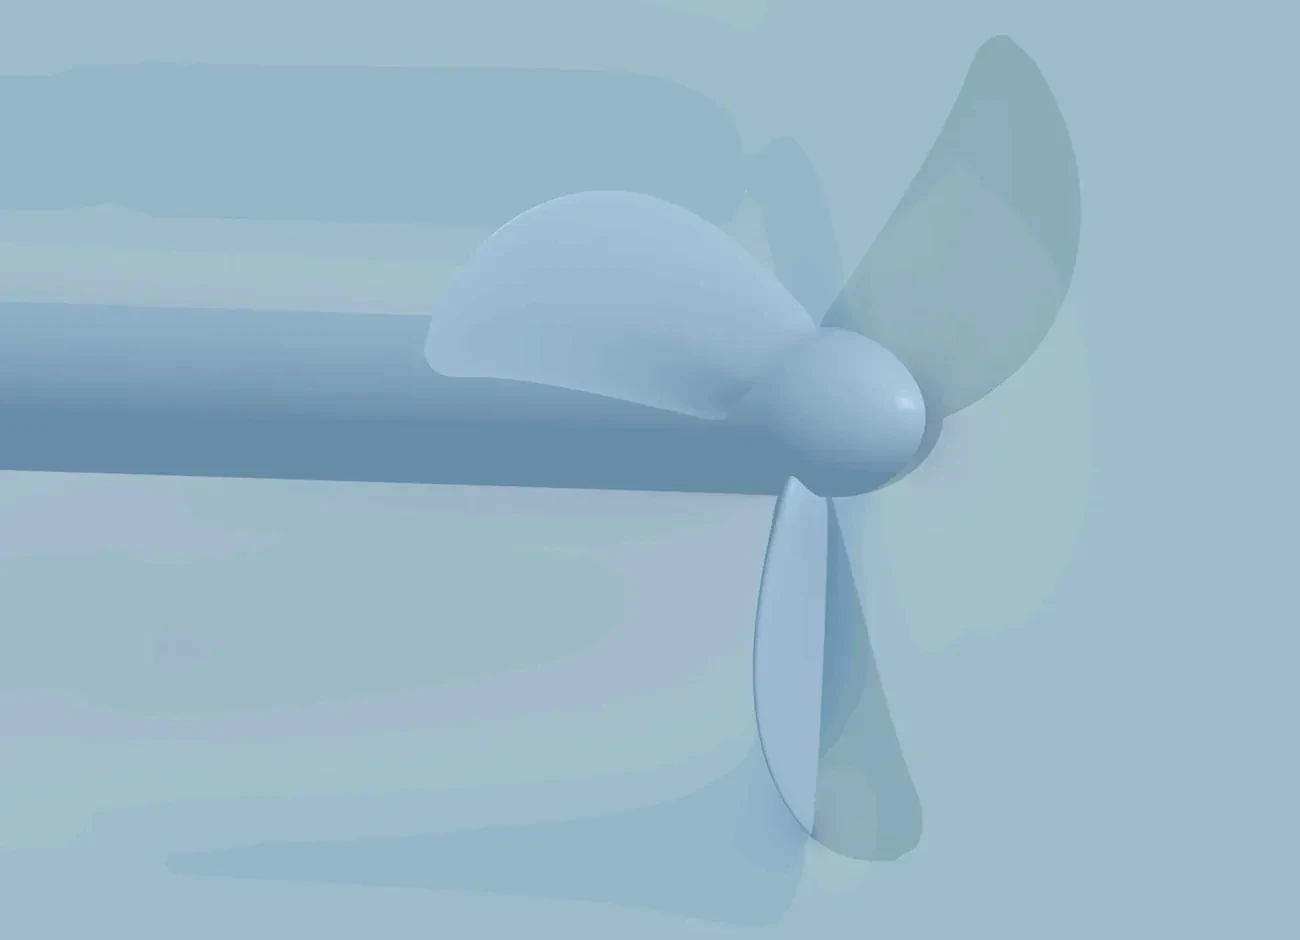
validated with RISEOpen flow, on a moving hull.
They may visually resemble propellers, but the underlying physics is fundamentally different. Propellers are designed to deliver power, and fixed turbines are much less sensitive to the impacts of drag. A mobile hydro-turbine is a very specific engineering challenge, where managing drag and achieving the optimal balance is key to a high-performance, energy-generating ship.
- RISE — Sweden's state-owned research institute, since Oct 2024
- Blade numbers, shapes, pitch angles — swept in RISE's own CFD
- Drag against hub power — for a harmonious turbine-vessel system
What the energy becomes. Hydrogen storage is the case study.
-
 The plant
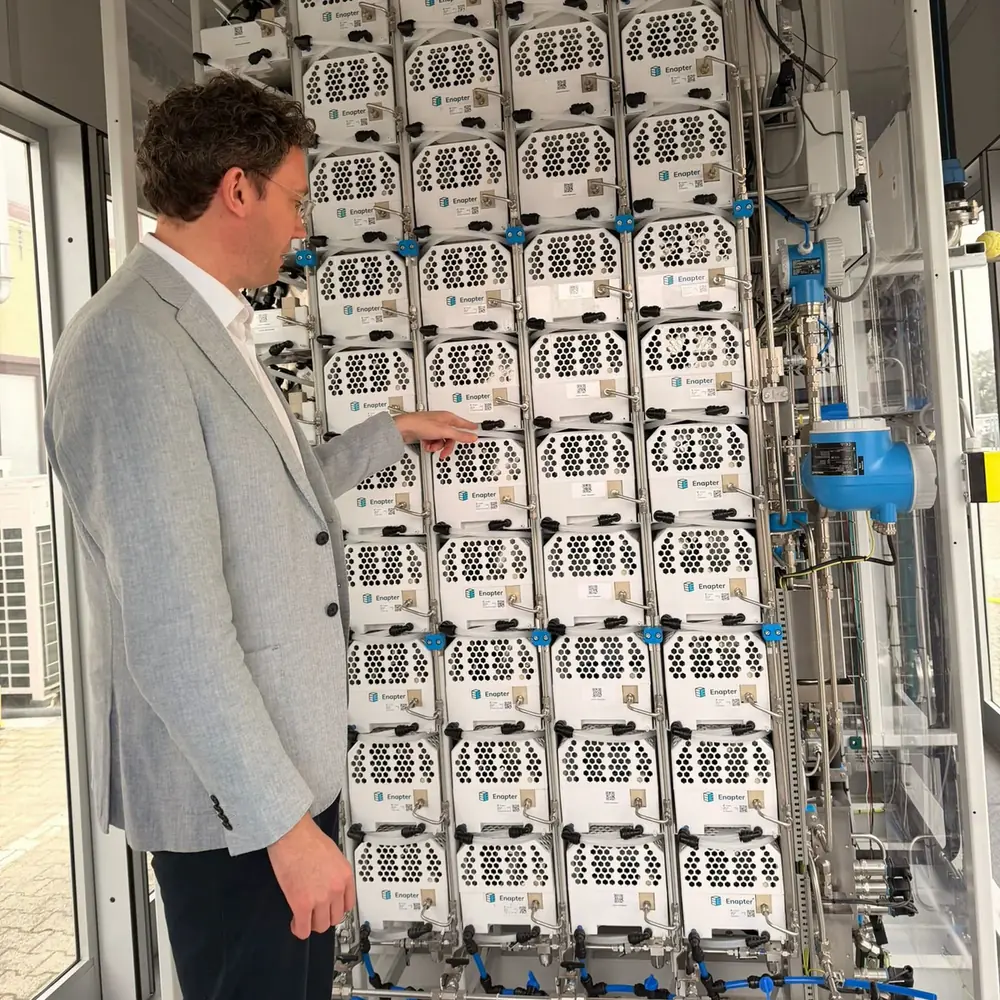
marinised with EnapterElectrolysis, at sea state.
Every commercial electrolyser on the market assumes a concrete floor, clean feedwater and a steady supply. A ship offers none of the three. Marinisation is the work of adapting the materials and components of the unit for the marine environment — tailored to withstand vessel motions, and delivered in a form factor suitable for ship installation.
- AEM — anion exchange membrane stacks, Enapter, Mar 2026
- Modular — a platform chosen for scalability, with redundancy inbuilt
- Certification — classification societies engaged; first marine-ready unit 2027
The CFD the ship is validated in.
DRIFT's first energy-harvesting ship is tested in Computational Fluid Dynamics with Cape Horn Engineering Ltd — the whole vessel at once, because hull, rigs and turbine influence each other's performance in the water. The models are accurate enough to predict vessel performance and to settle design decisions against it.
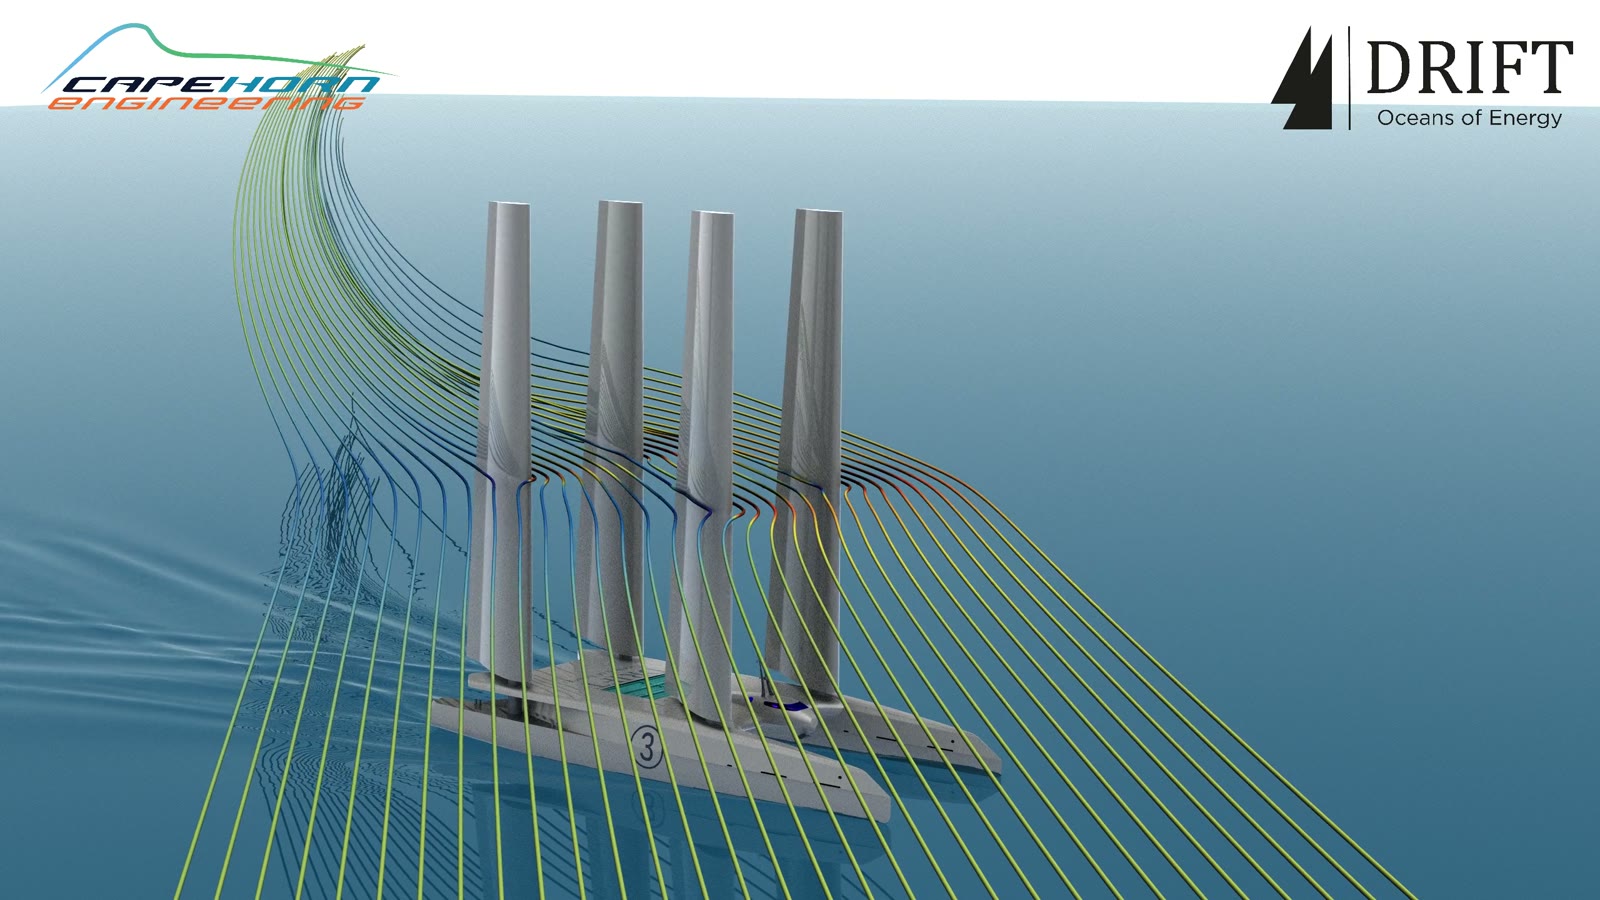
Computational Fluid Dynamics by Cape Horn Engineering Ltd.
Where this lands: the cost model →Named kit, not concepts.
PlatformCore
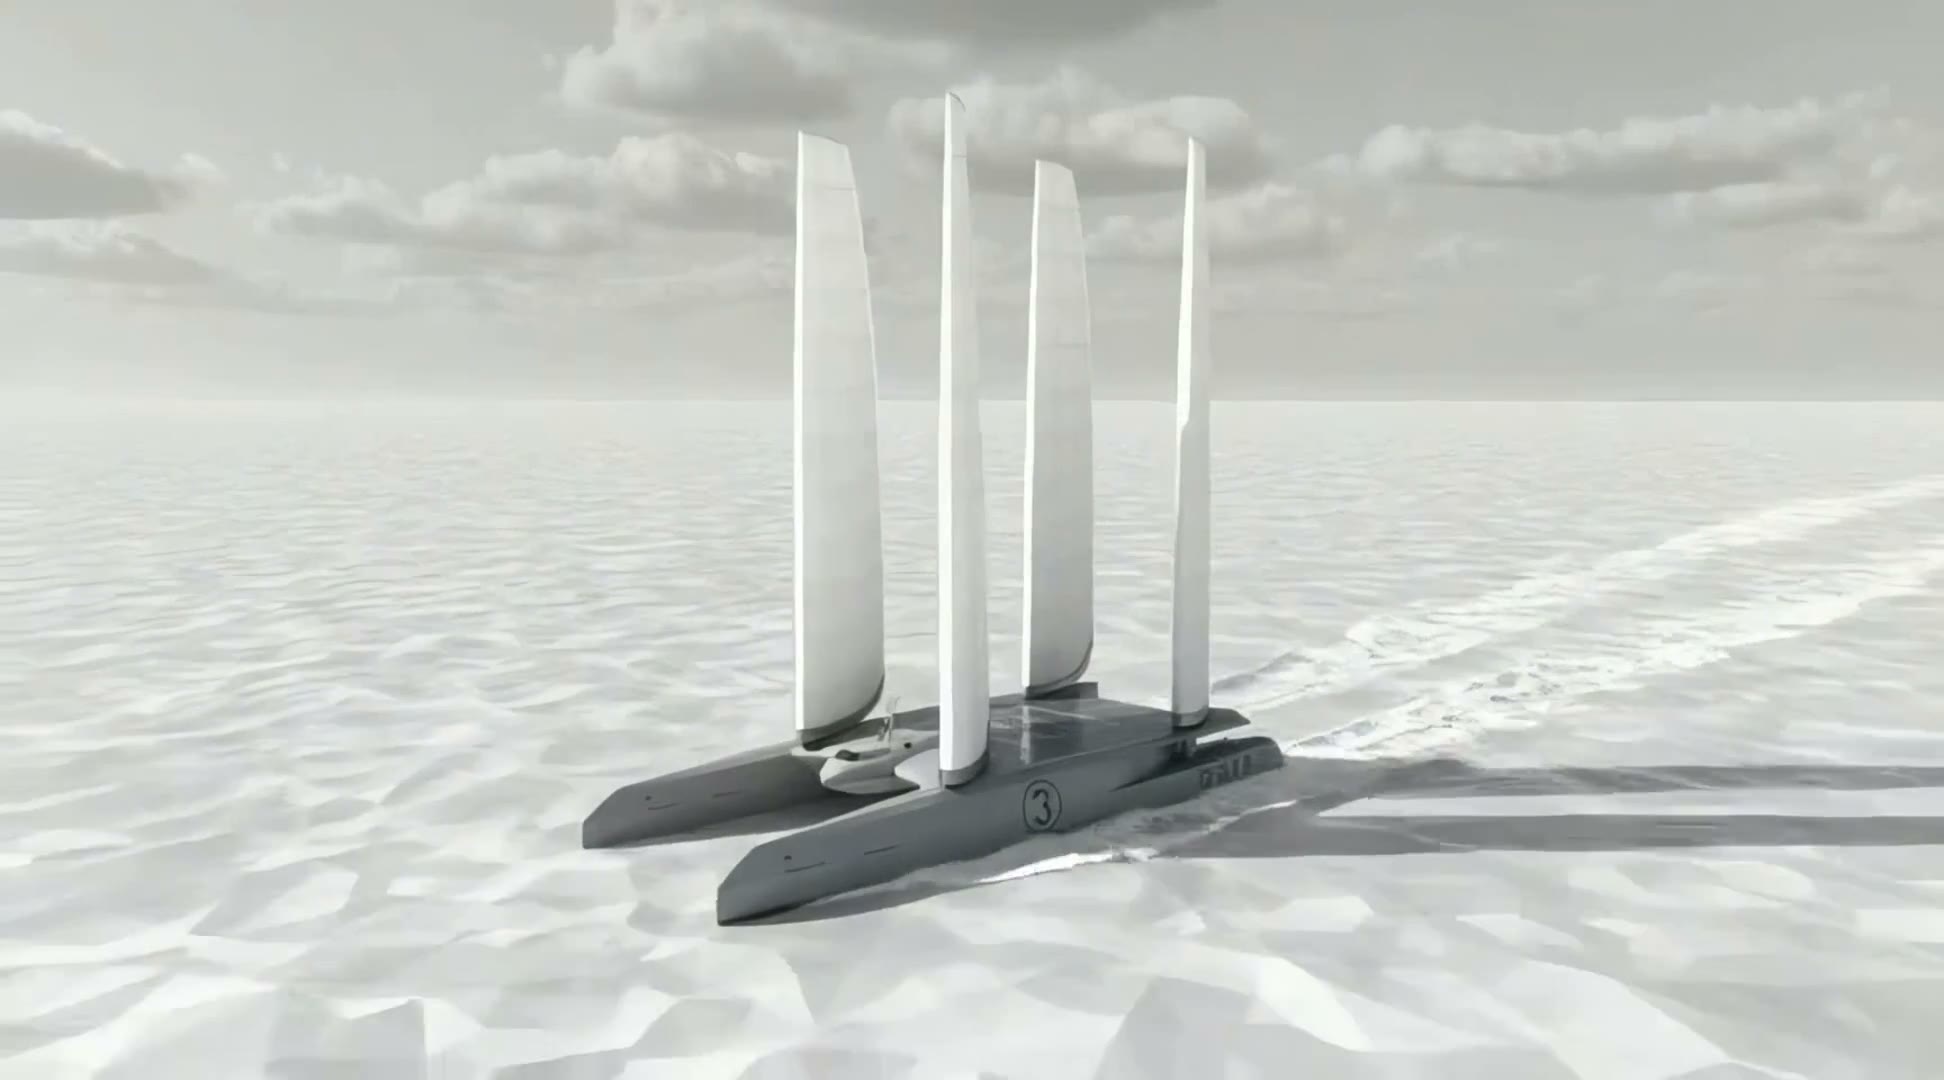
A 24-metre demonstrator, now a 60-metre commercial vessel, using the same architecture drawn from the superyacht market.
ClassCore
RINA Approval in Principle, 2026 — the first for an energy-harvesting ship design, and a step towards full plan approval rather than a substitute for it.
RigCore
Four aerofoil rigs. The sail area is set by the power the turbines have to make rather than by a passage speed, which puts a large area on a relatively small platform — a configuration conventional practice has no precedent for, and the reason the CFD is run on the whole ship at once rather than rig by rig.
GenerationCore
Open-flow hydro-turbines on shafts beneath the hull, converting boat speed into electrical power. Baseline blade geometry co-designed with RISE and moving into detailed design and manufacture through 2026.
ControlCore
Controllable-pitch turbines with azimuth and torque vectoring, autonomous wing-sail trim, and rudder movements used as the cheapest available way to trim apparent wind. All of it driven by one processor — see the stack.
ElectricalCore
Battery buffer for hotel load, so the ship runs its own systems off what it makes and the electrolyser sees a smoother input than the weather delivers.
FeedwaterHydrogen
Desalination on board. The electrolyser splits fresh water, so seawater has to be made fit for the stack before anything else in the chain can run — one of the reasons the plant is a plant rather than a box.
ConversionHydrogen
Megawatt-class Anion Exchange Membrane electrolyser, marinised with Enapter. Electricity in, green hydrogen out, with no shore-side plant anywhere in the chain.
CompressionHydrogen
Hydrogen is compressed to storage pressure before it goes into the cylinders. Output pressure is a design variable, not a fixed number: it trades parasitic load against how much gas a cylinder holds.
StorageHydrogen
Green hydrogen, stored in compressed gas cylinder.
Full vessel particulars — dimensions, ratings, tank capacity and rated plant power — are not published here. Request them through investor relations.
One number decides the ship: LCoH.
Capacity factor and annual energy production pull against each other through the turbine's rated power — raise the rating and total energy goes up while capacity factor goes down, so neither can be maximised alone. Everything below is balanced against a single target instead: the lowest levelised cost of a kilogram of hydrogen. Every variable in the tree carries its own datapoints behind it, rather than an assumption.
01 · Vessel design
02 · Performance
03 · Routing
04 · Economics
Want to know where we are with our commercial offering?
Request the investor pack →The five questions engineers ask.
If the turbine slows the ship, where is the optimum?
Not at maximum turbine efficiency and not at maximum boat speed. Power at the hub and drag on the hull are solved together across the whole polar, because extraction that costs a knot costs the rig apparent wind, and apparent wind is cubed on its way back into power.
It is why the turbine is rated to the wind speeds the ship will actually spend its year in — around 24 knots in the North Atlantic — rather than to the strongest wind it will ever see.
What actually breaks when you put an electrolyser on a ship?
Three things at once: saltwater corrodes the materials, vessel motion loads components that were designed to sit still, and the power input follows the weather rather than a schedule. Marinisation is the work of adapting materials and components for that environment, with Enapter.
The AEM stacks were chosen partly for in-built redundancy, so a cell failure at sea is a derate rather than a stoppage, and partly because the modules scale across hulls without a redesign each time.
Where does the fresh water come from?
Desalination on board. The electrolyser splits fresh water, so feedwater production sits inside the plant and carries its own parasitic load, alongside compression to storage pressure and the ship's own hotel load.
All three are inside the levelised cost, not outside it. A yield figure that ignores what the plant spends on itself is not a yield figure.
What happens when the forecast is wrong?
The route is re-solved every one to six hours against the current picture, so an error has hours to be corrected rather than a voyage. The routing model plans several time-steps ahead, which means it is already carrying alternatives rather than committed to one wind field.
The floor underneath that is the weather ceiling itself: less than 2% of the North Atlantic year is unusable — wind over 40 knots or waves over 5 metres — and a mobile asset spends most of that leaving rather than waiting.
Which of these numbers are actually proven?
Every figure on this page is labelled. Validated means a third party signed it. Modelled means DRIFT analysis. Target means a number the fleet is being built to hit, not one it has hit.
Nothing on this page has been measured at commercial scale, because no commercial-scale hull exists yet. Every figure's basis is named where the figure is. Ask us for the derivation of any of them.
And that is only the ship. An AI routing algorithm decides where it goes.
Everything above is a machine for turning wind into hydrogen. What tells it which wind to go and find — several time-steps ahead, and back to the quay as the tank fills — is GOLDILOCKS, and it has a page of its own.
GOLDILOCKS, the routing model →